adbrite ads

Your Ad Here
Your Ad Here

tickers

$IN

amazon

Sunday, August 26, 2012

BURN OUT!


 I've gotten a few emails asking about me...Many Thanks....im around but just severely burned out. Its hard to write a blog almost every day for 8 years and not go bonkers. It even took me this long to put up this post. I think i will be back day after labor day...assuming my brain continues to recover from being fried.


Wednesday, August 01, 2012


MLPS HOLDING BUT DOUBTS  CONTINUE


The overall market seems to be holding its own in stair step fashion since the June bottom on the dow near 12,100. Since then we have been in a back and forth battle which continues to be resovled with higher highs and higher lows. The movinging averages have been crossing back to a positive mode. MLPS meanwhile  behaved much better in this correction overall as they came down to 350 on the index and held. And they subsequently rallied back to 400 before hitting a wall. It is important to watch mlps from the standpoint of the overall market. They have been the leaders in both directions, topping first before the rest of the tape and bottoming first before everyone else. The wall that was hit at 400 is probably a good indicator that we could see the overall market rally from 12100 stall before too long.


MLPS have used the recent fall in long term rates as a good tailwind. But I continue to wonder (out loud) how much longer can the fed and falling 10 year rates support the overall market. Europe continues to kick its can down the road. They talk a good game but have really done nothing substantial as the crisis there deepens. Its hard to get optimistic about the economy here with under 2% growth. So the summer markets continue to trade along and mlps now will be sending their payouts to their unit holders. Lets see what happens as the ex distribution cycle plays itself out.


While all this has been happening natural gas has rallied nicely and seems to have decisively taken back the 3 dollar level.It is no conincidence that nat gas and the dollar have been moving strongly together since we are the big cheese as far as nat gas is concerned and suddenly having an energy commodity priced in dollars is a good thing. Nat gas mlps have been doing fine in this rally as price pressures ease so at least that tailwind has now been minimized. Some traders seem to think the bear market there will resume but the chart may be saying that the long term bottom at $1.96 might be it.

Markets are a little higher today as the fed is at center stage. Not sure if anything they say will really mean much since it all seems to be priced in. Jobs numbers come Friday.

Wednesday, July 25, 2012

THE MLP RALLY STALLS!


It was a wonderful run for mlps that took the index from 360 to 400 in short order and an upswing of 16 out of 17 days. But 400 has been a wall again and the chart does have the look of a triple top in the making. However notice that I linked these 3 charts as they continue to drive trading so far this summer.


First off MLPS have run higher since the last days of Q4 and I believe it is part of this massive pile on into anything that has attractive yield. Notice also while all this has been happening the Dow Industrials and for that matter all the broader averages have been essentially moving along a trend line which btw is bordered on the bottom by the 200 day moving average (not shown). And all this is going on in the face of the 10 year which broke below its April low of 1.46 and took a trip down to 1.36%, The bond market is clearly screaming deflation and markets may be starting to take notice. MLPS probably were able to sustain this tailwind but it is very disturbing to see all these downside divergences on the tape. Even some defensive stocks are beginning to show some wear. The selling in the last 2 days is probably overdue but we are about a week away from the quarterly ex distribution process. I wonder who is going to be left to buy once that process works its course. Its another 3 months until the next payout.

Sorry for the scant posts lately but work has been heavy with lots of overtime and its hard to sit in front of computer screen and write this blog while you spend 55 to 60 hrs a week in front of another computer screen. See my latest post on Equities.com btw where I've been posting weekly.


Wednesday, July 18, 2012

TWO CHARTS LINKED TOGETHER! 


In case you have been just way to busy trying to stay cool in a pool, ocean, or endless beer, mlps have staged a pretty remarkable rally here which began just before the end of the second quarter. We are up 12 of the last 13 days and there is no sign that anyone want to sell in here, particularly since the quarterly results will becoming out soon and most mlps will step foward and announce their usually 2% quarter to quarter increases in payouts. Since we live in a world where dividends and distribtuions are everything, getting 6% cash against a 10 year under 1.50% certainly looks and feels pretty good. Just exactly what the implications are longer term in my view can't be good. But it seems that as bearish as i have been lately, the overall market has just managed to pull back just enough to make you nervous but not enough to make u panic.

Earnings from the big boys, Kinder Morgan Partners (KMP) and Enterprise Products (EPD) will be out soon and those stocks are near 52 week highs. Certainly its a vote of confidence to see these mlps rallying back and the index is nearing 400 again. At least for now buyers are in control.

Tuesday, July 10, 2012

    MLPS SHOOTING FOR 10 IN A ROW!


Up again yesterday and up again this morning but the overall tape has turned lower as Europe and Italy are hitting headlines about tapping aid. The dow is up 10 points after being up 90 and down 30. MLPS are up nearly 2 points on the index and 390 is getting close. The 10 year is at 1.51% and is not far from its all time lows in yield. Right now (or at least since i disappeared for 10 days) mlps are moving counter to the tape. Natgas coming back to 3 bucks is probably also giving support.

Watch the tape to see what happens this afternoon.

Monday, July 09, 2012

BACK FROM VACATION..UP 8 IN A ROW!


I guess is should stay away more often! MLPS have staged a nice rally. They have cleared their declining moving averages and are up 8 straight days. The markets seem to be keyed on that 10 year rate which is now back down close to its all time low of 1.45% It is trading at 1.51% right now. Spreads remain stubboringly high at around 500 basis points but i guess the market is okay with mlps at these levels, providied the rest of the market does begin a serious circling of the drain.

And while i was away natural gas has been rallying smartly as well and traded above 3 dollars for the first time since January. When it it 3.06 on Friday sellers came in and took it down to 2.79. Nat gas is up today so this rally probably has more upside to it. Perhaps we may be getting into a new rage of 2.50-3.00 in nat gas which at least means that a floor in prices could be in.

 Still this chart has the looks of a longer term complex bottom in nat gas prices and i think the level to watch is still 3.00. A close above this with volume could mean a longer term bottom is in place.

MLPS right now are flat on the day with the dow down about 60 points. Markets seem to be a little softer but with not much conviction. The euro is rallying which is letting crude climb above 85 bucks although energy stocks dont seem to be following suit.

Wednesday, June 27, 2012

NATGAS BOTTOM? MARKETS ON EDGE!


Heading for a long vacation for all of 4th of July Week so posting will be minimal the next 10 days. Its been pretty minimal as it as lately as work schedules and family issues have been a bit overwhelming. So let me get to a few issues here going on.

Nat gas is staging a rally off what appears to be a significant bottom back in late April. What is very important is that we have broken out above 2.75 so we may be headed back to 3 bucks which for years was the old line in the sand. At least it appears that the nat gas market may try and get above that. Meanwhile take a look at the nat gas mlp etf and notice that this bottom in price has not rallied these stocks. In fact the reverse is true. This is something we need to pay attention to. Something else is going on here and it could be that maybe these companies have so reflexively hedged themselves for falling nat gas prices for years that maybe they are going to get caught short at least at this particular turning point. I guess we might get some idea on this come late July when earnings come out.


Meanwhile the dow and MLP chart are not inspiring. The mlp index seems to be getting ready for another trip down to 350 And the dow chart is moving in tandem.


These are not inspiring charts and i think the summer could bring us turmoil as Europe unravels. But its end of month, end of quarter, and end of half year and at least for the next few days we could see the usually nonsense of money getting moved around from A to B and then back to A.
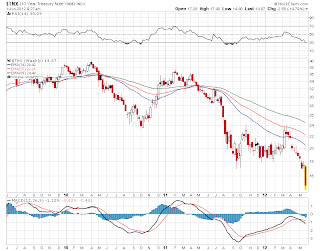
Frankly its hard to see how markets can rally when you have a bond chart that looks like this. Those looking for a hopeful summer might be better off looking for it at the shore.

Wednesday, June 20, 2012

MLPS LOOKING FOR LEADERSHIP


Yesterday's mlp inde 6 point gain aside the mlp tape has been holding that 350 bottom so far but looking at this chart, the bounce to almost 370 has been pretty much as expected.
The rally back has only taken us to the first decending downtrend line and we will probably hit it this morning. At least we will get to see whether this is a brick wall for the index. I continue to be disturbed over the fact that the group is no longer a market leader and while the dow chart looks a little more positive, mlps continue to signal that there may be something wrong with the overall markets.
With 6% plus yields and a 500 basis point spread against the 10 year why are investors staying away? Is it the overall bear market that has developed in energy stocks as a whole? Crude oil has moved from 110 to 80 bucks in a big hurry. Just as mlps signaled that things were going to improve in 2009, i think mlps are telling us that things are going to get worse over the coming months.

This morning we see markets flat ahead of the fed which may be a market mover if they don't give markets the QE3 heroin. Crude this morning is down a little while nat gas continues its rally which has been impressive but for now, still looks like a bear market rally.

Tuesday, June 19, 2012

WHERE IS THE BOUNCE? 


We have seen no real bounce in MLPS which have been in a downtrend since the late February top and after hitting 350 notice that the rally back has been miniscule. This has come with the dow industrials bouncing from 12,100 to 12,700 and they have nosed above the moving averages which have only just recently crossed and turned down.


Frankly i do not regard this move as a positive. Something is clearly different here then in prior sell offs and rallies in that MLPS are no longer leading. Rates continue to hover near record lows so the price pressure is not coming from that sector. However we may have seen a real collapse in oil prices. Notice the brent chart has really fallen off a cliff here as we have gone pretty much straight down from 125 to 95 with hardly any sort of important bounce. Is the crude oil market signalling are real falloff is coming in the overall economy? Certainly the world oil price is telling us that Europe is in recession. China demand continues to drop. At least all this is good for gasoline prices but it is pressuring energy stocks as a whole. MLPS are probably suffering from the bear market in energy stocks as a whole. But keep an eye on the 10 year yield because if bonds continue to rally and we break below 1.50% it could be a real sign that the economy is headed for a tailspin. Yield spreads in mlp land continue to hold near 2012 highs of around 500 basis points. Anything higher could spell trouble.

Nat gas meanwhile seems to have put in a bottom around 2 bucks and we came back down to just above that last week and now we are rallying rather nicely and with some volume which is good. Nat gas needs to take out 2.80 to make this something more than just a bounce. The chart certainly is beginning to feel like it is trying to put in some sort of meaningful longer term bottom. Certainly the fact that no one believes is a positive.

This morning we have slightly higher stock futures while crude is down and so is nat gas. No news to speak of this morning and no upgrades or downgrades. Yesterday we had Markwest profiled on Mad Money. Its worth a look since Markwest (MWE) has been one of the better performing mlps of the last few years.

Sorry for the lack of posts. Lots of family stuff going on makes regular blogging difficult.


Tuesday, June 12, 2012

NOT LOOKING HOPEFUL IN MLP LAND
The bounce we have had from the push down to 350 last week has been rather unimpressive as we could only seem to manage a trip back to 365 and while the overall market attempts to find some sort of footing, the index here is signalling to us that things in mlp land are not all that well. The bottom line is the bottom and there is no sign of one here. The index is down today by about 1 point as it catches up from yesterday where the market started sharply higher and closed sharply lower. Sometimes it takes us a day to make things even.

Its all about Europe of course and there is no sign of that problem being solved anytime soon. In fact the action this weekend and the market's reaction to it are telling us that troubles lie ahead.

Sorry for the lack of posts but between work, family issues, and rebuilding a deck, its been really difficult to find the time to write.

Friday, June 08, 2012

THE BOUNCE!!! 

The bounce has occured and it has been a fairly nice and predictable 5% rise for the mlp index from 350 to 365. Looking at this chart with the downtrend its going to take a move above those declining moving averages to get me excited here. The rally was going to happen and if the selling resumes and begins to accelerate again it means probably another trip down to the 350 level. That will happen if Europe begins to unravel in a big way. They seem to be walking along the edge of the cliff every day. My question is if the unraveling really happens, what is it going to look like? And what exactly sets it off. Do we wake up one morning with futures down 1000 points? We certainly hope not. I just wonder what the actual event will be that could set the market spiral ala lehman in motion.

No news for mlps this morning and no upgrades or downgrades. A couple of observations. Crude is down 2 bucks this morning to 82 dollars. If the rally of the last few days were meaningful i think you would have seen oil back at least into the 90s. Crude did not move in this bounce. Nat gas rallied to 2.50 and now it looks like we may be headed for another test of the 2.00 level. Is Crude signalling real trouble in the economy? The ten year is under 1.60% this morning so i guess we try for 1.50% again. Barrons calls this the opposite of irrational exhuberance as irrational despair and thats what the bonds are telling us. And here is my prediction for tomorrow...I'll Have Another wins the triple crown. He continues to improve and all of the other shooters have problems of one sort or another that puts them one or 2 levels below the class of  the Derby and Preakness winner.

Tuesday, June 05, 2012

NO BOTTOM IN SIGHT!

The 2 charts above pretty much tell the story in mlp land and its not a pretty one right now with the index breaking down 8 points yesterday and approaching 350. Support to me on a weekly basis is somewhere around 320 which is where mlps bottomed last August. There seems to be no support here and the index won't be helped today with Kinder Morgan (KMP) doing a secondary and the stock down about 1.70 points at the open. It is particulary distressing to see yield spreads in mlps blowing out a bit here. The spread on Kinder Morgan is a little under 500 basis points and that is awfully high if markets were behaving well. Now we are no where near some of the spreads we saw back in 2008 where those spreads blew out to double digits in many individual cases. But being up at these levels is something we need to pay attention to especially if Europe begins to really circling the drain.

The market indexes are trying to hold here at the open with the mlp index drawing a line in the sand here at 350 and most issues in the group save for Kinder Morgan are moving fractionally in either direction.

Friday, June 01, 2012

Down 212, Nasdaq down \60 and the MLP index is down over 8 points. All important support levels appear to be breaking. The Dow is now down for the year. The tape is not looking good. And with the 10 year dropping under 1.50% and mlps selling off hard, we are seeing yield spreads here blowing out to levels not seen since 2008. These are not good signs.
Dow at the lows of the morning down 190 and mlps are now below 360 down nearly 6 points. Just noticed the euro is actually rallying here. Gasoline at 2.66 in the futures which means 3.25 gasoline sometime soon.
BREAKDOWN! 

These are the charts we are looking at this morning just before the open and now we have markets in sell off mode.The employment number is point to recession. The 10 year dropped to 1.44% before the open and the dow opens down about 140 here.


The mlp index is down 3 right now and looking at that 360 level. Brent has broken below 100 dollars for the first time since last fall. So things are looking ugly this morning and we will see whether buyers will appear at some point. Enterprise Products Partners (EPD) got an upgrade but it doesn't matter as the stock is down with all the other mlps.

The dow is sitting right now at 12,220 which means all of the years gains have been wiped out.

Wednesday, May 30, 2012

A massive pile on into the 10 year which is now down to 1.63% and the dow is down 150. MLPs are down 7 on the index and getting back down to the lows of a week or so ago. Markwest (MWE) is under 50. Kinder Morgan (KMP) is under 80. Lots of losers on the order of strong fractions to a little over 1 point.

That 1.63% 10 year is pretty scary if you ask me.
SEARCHING FOR A TRADEABLE BOTTOM?


 Just back from a very long weekend dealing with soccer tournaments and speeding cameras in Maryland where apparently its a second source of income by nailing unsuspecting out of towners. So im playing a little bit of catch up as we take a look this morning at the charts to see where we are.

After a couple of months where the mlp index was under performing the markets, it appears that the market and the mlp index are now pretty much in lock step since the beginning of May as they have been going down together. Now we have a move sideways over the last week or so and we have some of the technical indicators telling us that the markets are oversold enough for a tradable bounce. But i believe that any bounce up will probably be capped by the downtrending moving averages which like a few percent above these levels. MLPS are in a world of shrinking margins here along with dropping demand worldwide and a 10 year yield spread above 400 basis points. So we are in one of those areas where caution is advised.

No corporate developments to trade on this morning and no upgrades or downgrades so we will be watching Europe. Spain was down over 5% earlier but has now rallied back to unchanged on the latest European bullshit regarding recapitalizing the banks. Crude is under 90 bucks and Brent is nearing 105. Nat gas is down to 2.42 and could be signalling that the latest rally that started at $1.96 may have run its course. Watch the 360-365 level on the mlp index as the week rolls on.

Wednesday, May 23, 2012

THE CIRCLING OF THE DRAIN!


Euro woes dominate the tape and markets are looking at the exit doors and using it. The dow is down 180. We have the S&P index below 1300. The mlp index is moving right along with everything else and the index is down over 5 points and just above last weeks' lows. Barrons Online (no subscription  needed) had a blurb about mlps and their behavior last week and it pretty much sums up the problems here. We have falling commodity prices, shrinking margins, and euro fears. In the end Europe is driving the tape and if the selling gets ugly..people will sell what they have. These days they have a lot of mlps. And i would slightly disagree with the perspective of buying the big boys in mlp land right here. If the sell off  gets ugly, they are overowned and will get sold down pretty hard. The good news however is that when a rebound comes (im an optimist)..they will run back fairly quickly.

Plains All American (PAA) Kinder Morgan (KMI) and Suburban Propane (SPH) are the biggest losers here down 1 point and change on each. The index just hit its lows of the day...down over 6 points.

Tuesday, May 22, 2012

MLPS BOUNCES FROM ROUT!


Yesterday's 8 point mlp gain pretty much undoes Friday's 9 point mlp loss. Looking at the daily chart the selloff Friday brought us down to 365 which is not far above the initial 360 target i mentioned. But right now the bounce looks like nothing more than that as we went pretty much straight down from 400 to 365 over a matter of 2 weeks. I thought that the weekly chart would prove useful here and notice we are sitting right on the 89 week moving average. From a weekly standpoint the chart is telling us that we may be putting in a longer term top. A breakdown from here takes us to support at 340 and from there its down around 290. Overall the tape remains bearish and the markets bounce yesterday was just that unless proven otherwise by the tape staging something more that a 2 day rally.

This morning we have futures slightly positive. Crude is down a little and so is nat gas. Interest rates continue to hover not far off all time lows in yield. The dollar is rallying especially against the euro.Nothing on the corporate news front this morning and no upgrades or downgrades.

Wednesday, May 16, 2012

MLPS TRADING WATER


Mlps are a little higher this morning thanks to dead cats bouncing in an overall messy tape. The stock market is now reacting to news of bank runs in Greece and the ECB threatening to cut off funding to some Greek banks. So its pretty much a mixed picture in mlp land with fractional moves in either direction and no real standouts. About the only supporting action is, in of all places, nat gas which has rallied 25% from the 1.95 bottom and we are now up over 2.50. Overall though the dow is up just 20 points after being up 60. Crude is down another buck at 92 dollars. Afternoon trading should be fascinating as the Euro obsession perhaps drives people to at least keep an eye on the exit doors.

Going to be college shopping for the next few days which is a frustrating exercise in picking out which school gets to suck my checking account dry. 

Monday, May 14, 2012

          ON THE EDGE OF BREAKDOWN!
If the mlp chart was regarded as the leader on the rally that began in December 2008 for mlps and ended January 23, 2012, then its been sending ominous signals for the last 3 months and right now with a 3 point loss on the day, we are sitting at 380 which marks important support in my view and we are just ticks from breaking through that support zone. Its important because it came down to that level back about a month ago and rallied back above 400. That rally failed so now we watch closely for the dam to break this afternoon.


The dow chart meanwhile has put in a double top and we watch this 12,700 level which also looks very dicey and may breakdown here as well. The dow is down 100 at 12,723 right now. Euope is the driver and it looks like they are circling the drain overseas in a big way. And they are apparently going to take us down with them.

A few folks sent me some notes regarding JP Morgain and their recent trading debacle. Some are wondering whether this is Lehman and 2008 all over again. The Lehman unwind brought the mlp index down to 145 in almost cataclysmic fashion. That wound up being a lifetime buying opportunity. At the time Lehman held large postiions in many mlps which had to be sold in a down tape at any price. This made for a blood bath. I dont see the similarities here between Lehman and Morgan. For one thing mlps are now pretty widely owned and no longer thinly traded like they used to be. And while JPM made a big boo boo its not the kind that bring the entire bank down. If it did, i frankly dont think it would matter what you owned..the outcome would not be pretty.

The mlp index as i type is now below 380. Copano (CPNO) is the biggest loser down 1 and change after losing nearly 4 dollars late last week on a not so good earnings and outlook. Energy Transfer Equity (ETE) Atlas Energy(ATLS)and Cheniere (LNG) are also shedding a 1 point and some change each.

Wednesday, May 09, 2012

THE VIEW (OFF THE CLIFF)? 


Okay so maybe its overstated but we are approaching 380 on the mlp index after yesterday's multipoint loss we are sitting just above it this morning in a soft overall tape. So we will watch this level carefully. If this goes than it seems 360 would be the next logical stop for the mlp index. This drop is coming with the 10 year yield approaching its record low of last September of 1.71%. We are at 1.80% as  of this posting. That 10 year move down in yield is coming thanks to Europe and its absolutely endless crisis.

This morning we have Markwest (MWE) down 2 points on an equity offering  so thats going to weigh a bit on the mlps index. No other mlp news on the tape this morning and no upgrades or downgrades.

Buckeye Parnters (BPL) has been in the dog house for quite awhile as the chart indicates and it has gotten even uglier in the dog house lately thanks to last week's earnings report which by any measure was messy and from a dcf standpoint was not good. I have a piece on this on Equities.com  and will post the link as soon as the story hits.

Monday, May 07, 2012

IS THIS "A" TOP OR "THE" TOP 


Both charts above are speaking to us this mornng in some fashion. Friday's dismal employment numbers pretty much re-enforced the idea that the economy is going no where fast as the workforce continues to shrink. The mlp chart topped in January and mounted a rally recently from 380 to 400 but it appears that 400 is the new wall as the index got turned away from there. Now as markets sell off we will watch the 380 level on the mlp index to see if that goes because if it does get taken out, it is a sign that a downturn has begun that may last for awhile. And i think this would of course be coupled with the overall market making a move lower. 12700-12800 is the level to watch there.

This morning we are seeing Barclay's and UBS cutting their price targets on Buckeye Parnters (BPL) which has been sinking since its' earnings report last week. It and Nustar (NS) have been the 2 weakest mlps among the large mlps out there and they have had a bit of an impact on the mlp index. Stock futures this morning are lower but they are well off the overnight session lows as Europe is moving markets after elections. Crude is down under 100 and lower this morning but also if its lows. Nat gas has moved solidly above the 2 dollar level and sits at 2.32 this morning. That 2 dollar level might be visited for a retest at some point.

Tuesday, May 01, 2012

MLPS NEARING 400 AGAIN!

Mlps are up today but lagging a little behind the excitement in the rest of the market. We are up fractionally here with most mlps up fractions. No big movers today one way or the other. We just seem to be extending yesterday's move which came off the Energy Transfer (ETP) buyout of Sunoco (SUN).

I have been writing some pieces for Equities.com for the last 2 months and i want to share them with you. I've had my hands full with so many things lately so the blogging has been a touch light. There is a whole mlp section there that everyone should take a look at.

Monday, April 30, 2012

ETP BUYS SUN!


Short headline but right to the point this morning.Energy Transfer Partners (ETP) which has been a chronic underperformer in the mlp group made a big purchase today as it takes out Sunoco (SUN) for 50 bucks a share..1/2 in cash and 1/2 in stock. Both stocks are up on the news with SUN up nearly 8 bucks and Energy Transfer is up 1.60. Energy Transfer Equity (ETE) is up 1.92. The move diversifies ETP holdings and might be a driver in the stock price going foward especially in the NGL and logistics markets which have been quite strong. In face ETP is approaching a 52 week high and may challenge the top it made early in 2011.

MLP meanwhile as a whole continue to hold their own in here although still off their highs. Markets are down today but the group is up 1.75 as of this posting. Earnings news from Holly Partners (HEP) and its one cent distribution hike was pretty much in line. So far except for Nustar (NS) which took a hit on its earnings, the corporate numbers have been typical of the group and distribution increases have been priced in.
410 on the mlp chart remains the near term challenge and 380 is the near term support. Neither side seems willing to give at this point so we will follow the overall tape and see where it takes us. We are into May where significant tops were built a year ago. So far it appears we may be following a similar path.

Wednesday, April 25, 2012

Nustar (NS) put up earnings and said all the right things on earnings but not on distributable cash flow which it said was well below 1x.. The stock is down 2 dollars on the news. When your paying out 1.09 and only have 60 cents, this could be a problem down the road. Still the company says everything business wise appears to be in good order.

MLPS as a whole are down today as market attention remains on the NASDAQ and Apple. Energy stocks dont seem to be participating all that strongly in the rally which is pretty narrow in scope.
MLPS CONTINUE TO STRADDLE!


MLPS have not exactly set the charts on fire lately as they continue to stairstep their way lower from the 410 high back in late January. At first it seemed that mlps reacted to the push up in yields to 2.40%. That took the index down to 380. But since we hit that 2.40% level, rates have turned lower again.


The latest move down from 2.40 has brought us under 2% occured rather quickly. That move is coming as Europe continues to basically unravel on a daily basis. The overall market continues to de couple away from that. But at some point its going to matter. If yields break below 1.70 it will be a sure sign that decoupling from Europe is the wrong play. MLPS may benefit from the tailwind of falling yields but not if it comes with an overall market meltdown. Im not predicting this but one needs to continue to watch what the bond market may be telling us.

Markets are opening higher this morning. MLPS are higher at the start. But everything is about Apple Computer (AAPL) which blew away earnings. So for now we have an up dow...nasdaq is soaring...and we sit back and watch.

Monday, April 23, 2012

     MLPS SET TO MOVE LOWER !


Getting used to the new blogger format which is a bit confusing but i will figure it out. Markets this morning are reacting to European woes as those markets sell off hard and that leaves us down over 100 dow points pre open. The mlp chart rallied nicely last week as the 380 support level continues to hold for the time being. But i think we will see a test of that level this week which is about where the 200 day moving average lies. MLPS hit their top of 410 back in late February and have not been able to come close to that high. Its a little disturbing that we see this pullback even though 10 year rates have not rallied above 2.40. In fact after that spike up to 2.40, yields are now back below 2%. Could we be setting up for a major selloff? I guess it all depends on Europe and whether markets want to repeat last year's pattern.

No corporate news this morning and no upgrades or downgrades so look for the group to move in tandem with markets. Crude may test 100 bucks if the selloff really gets going after the open. Nat gas is under 2 dollars and seems destined to head even lower.

Wednesday, April 18, 2012

KINDER MORGAN EARNINGS AFTER THE CLOSE!


MLP leader Kinder Morgan (KMP) will be putting up its quarterly earnings after the close today and we will probably get the usual distribution increase that comes every quarter from the big daddy in MLP land. Seeking Alpha has a piece on Kinder with regards to their distributable cash flow. Its an interesting piece in that the writer concludes that at some point Kinder Morgan may simplify its collection of interests and stocks (KMR,KMP,KMI,EPB) ala Enterprise Products Partners (EPD).


Markets rebounded yesterday and so did MLPS but you have to wonder whether it was just a one day wonder given futures are softer today ahead of the open. MLPS rebounded yesterday but the chart has that feel that the top building process continues. The 200 day moving average continues to hold at 380.06. That to me is the line in the sand. The dow chart has turned sideways and i think that a break by mlps could be a sign that the market rally may have run its course.
What has not run its course is the bear market in natural gas as we are now solidly under 2 bucks and no sign of any meaningful bottom. In fact the bears are so numerous in nat gas that we may have to look for some sort of climax selling event that might finally signal a tradeable bottom. The decline here has been nothing short of merciless.

Monday, April 16, 2012

DECEPTIVE RALLY COVERS UP WEAKNESS!


About the only thing that is up this morning is the dow industrial average which is still hanging on to a 46 point gain but everything else is selling off and Nasdaq in particular has an almost 1% loss as recent leaders like Apple and Google take big hits. Meantime i thought it might be a good idea to see if there has been any damage done to point and figure charts concerning mlps and a few other things.


Some bearish signals have been thrown by these charts. Kinder Morgan (KMP) went bearish weeks ago and the charts have a price target of 71. Note that the index itself continues to show a bullish target of 492 while bearish signals are evident. Stocks like Oneok (OKS) and PAA (PAA) continue to show bullish price targets of 100 and 112 respectively (a little hopeful perhaps) so at best lets say its a mixed picture here. Still we continue to pay attention to the mlp index and the 380 level which is wear the 200 day sits and for now continues to hold.

The index this morning is down nearly 2. Citigroup is cutting price targets on Alliance Resource (ARLP). Note to citigroup...the market sort of did that for you in the last few weeks with the stock going from 80 to 50 in a big hurry. It has rallied back to 57 on a dead cat bounce. Not much else happening this morning. No other corporate news of consequence and nat gas continues to explore the price areas under 2 dollars. The point and figure chart has a 1.50 price target for nat gas.

We'll see what afternoon trading brings but given the divergences in the tape and the nasdaq weakness, i would guess sellers will take the upper hand later on today.