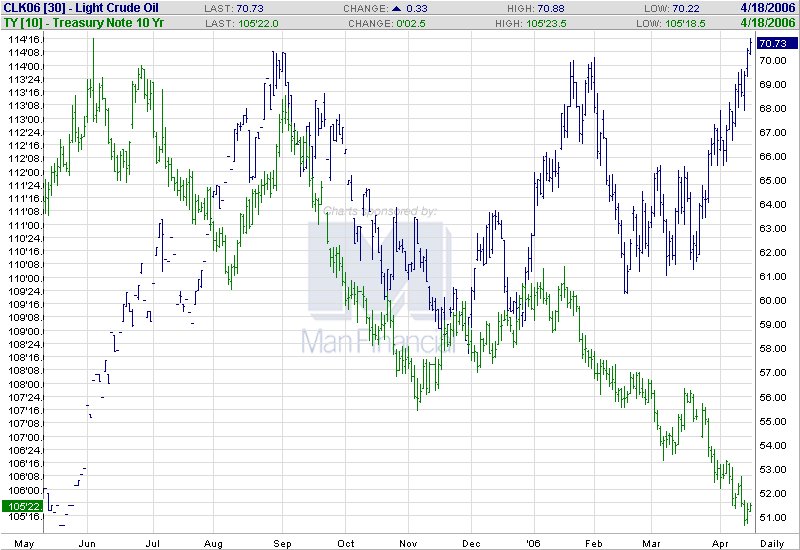
Its the Crude vs 10 year chart which is one of my favorite charts to look at. Notice the bond price decline continues but now we're at that critical spot again of 70 bucks. Will bonds turn and start to rally here indicating that crude will begin impacting economy by slowing it down? Or will bonds continue to fall in price while crude rises...indicating that inflation is a bigger problem?
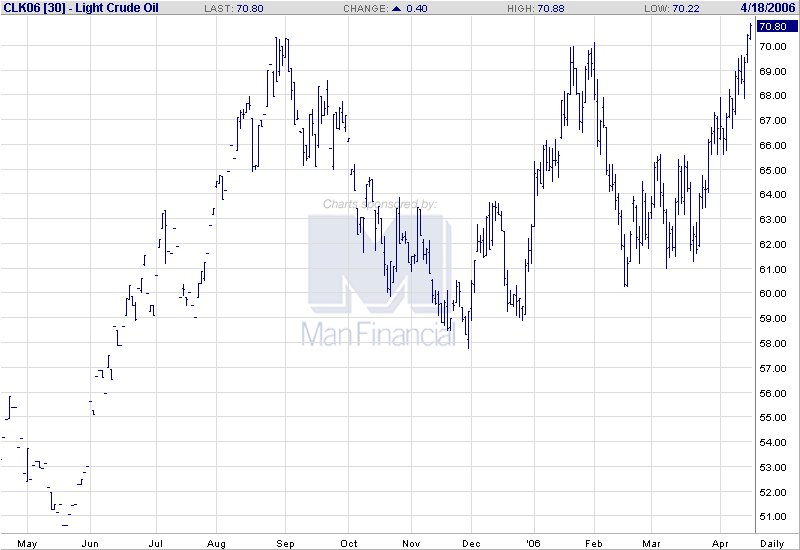
And of course we have the crude chart by itself which looks like it has traced out a W bottom formation as we breakout above 70 bucks. PPI is up .1 ex food and energy (since we don't eat or use gas). Housing numbers look weak so yields are dropping...at least the initial reaction.
Meanwhile in MLP land no upgrades or downgrades this morning and no corporate developments.


 joseph cioffi's Source Page - Associated Content


2 comments:
"However, outside of the volatile energy and food sectors, core inflation was well-behaved in March, rising by just 0.1 percent, leaving core inflation rising by a moderate 1.7 percent over the past 12 months."
Time for the fed to stop raising rates. They have NO influence on world energy markets, and everything otherwise is quite tame.
looks like the fed heard you!
Post a Comment