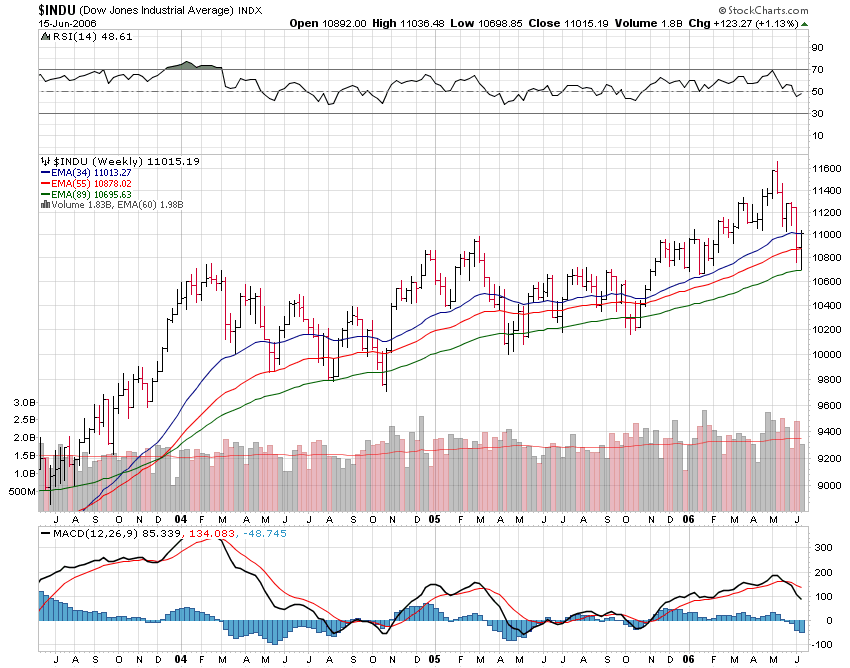
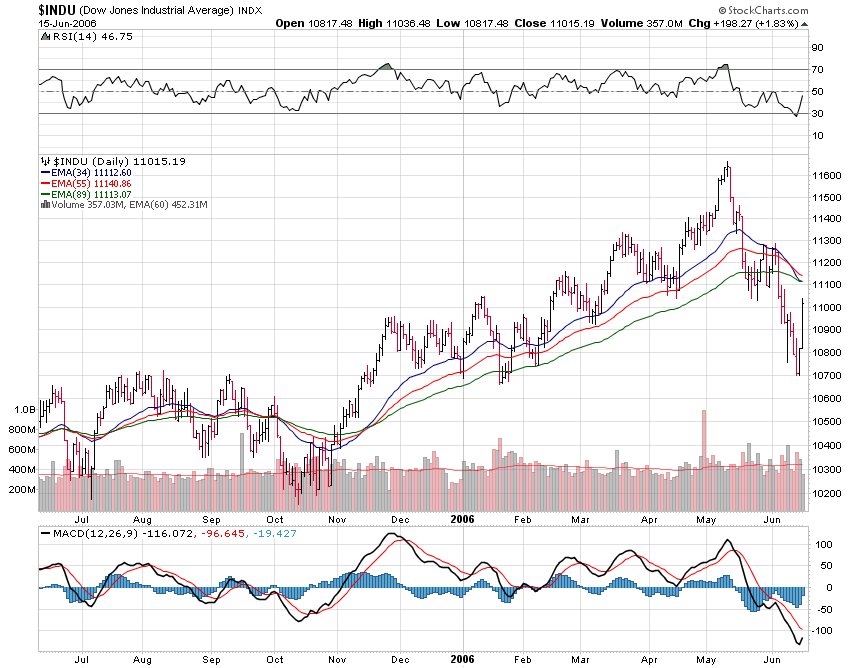
If you like charts i posted the dow industrials daily and weekly chart. On the daily this rally should carry to the downtrend moving averages around 11100 ish...I would expect to see some selling to come in at that level. Note that on the weekly chart the 89 day expotential moving average has held in the overall uptrend and it has held again at least so far. 10,700 on the dow now becomes the new base level which needs to be watched.
As per moving averages i use fibinocci numbers 34,55,89,144,233 day. They seem to work well most of the time.


 joseph cioffi's Source Page - Associated Content


No comments:
Post a Comment