I'm blogging while i'm working.
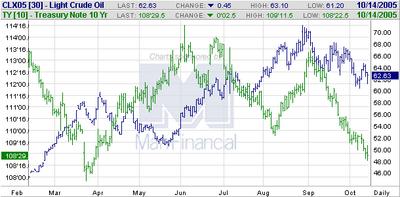
Time to revisit the 10year vs crude chart. A couple of things to note...First off notice that crude has been in a channel between 60 & 70 dollars since early August. And the 10 year price (inverse to yield) has been declining (yield rising). The 10 year is retesting its April bottom as crude retests 60. I would argue that we are still linked...that is crude is linked to yield. As crude rallies yields fall. The bond market is essentially saying that 60 dollar oil is the point where there is economic impact. If crude rallies this week...and one catylist could be a new tropical storm or hurricane for the Gulf Of Mexico...look for 4.50 yield barrier to hold and for MLPS to end their correction and begin moving higher.


No comments:
Post a Comment