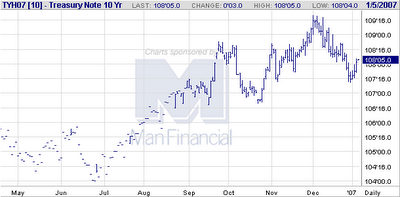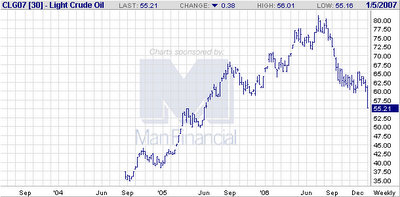
Though we'd do something i haven't done in a long time and that is to look at the actually energy commodities and their behavior. Firt off notice that on the 10 year vs crude chart the relationship now has inverted to a disinflation mode. Note that the rally in bonds began in July near the oil top at 80 dollars. And as oil has continued to sag rates have continued to fall. This is the reverse relationship of what was going on prior to the July 05 peak where both oil and bonds were moving together. So this chart is telling me that inflation is becoming less and less of an issue; certainly with respect to oil.

Meanwhile 10 year yields continue to fall as we wait for a clear bond breakout to 109-110 and beyond. So at least with respect to yields...MLPS still have a favorable rate picture.

Meanwhile did you ever see a chart so ugly looking as the nat gas chart? No sign of a bottom here although clearly we did just make another leg down and maybe 6 dolllars is a good place for a floor.

And of course this equally hideous looking chart in Crude Oil which as we speak is seeing oil now with a 54 handle and at 18 month lows.
So at least at the start of trading this morning we're looking at more pressure on big energy stocks especially with a major brokerage downgrade on Exxon Mobil...add to that general pressure on stocks in general after a big Japan selloff last night and you will see some opening pressure on MLPS at least at the start. Two things to look for will be whether big energy stocks will put a temporary bottom and rally against falling crude prices. The stocks usually turn before the commodity so that will be a clue. Exxon (XOM) or the XOI are the best proxies to watch here. Secondly will be the bond reaction to the employment numbers at 8:30am. If yields fall that should put a floor under MLPS today. Also the many downgrades of tech stocks could see money move to more defensive positions and thats good for us.

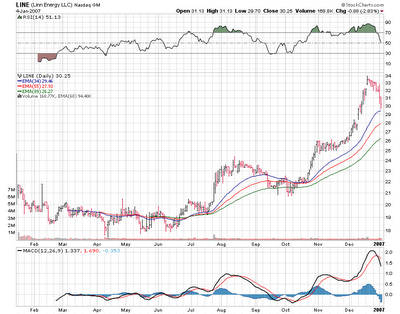
Meanwhile Lin Energy (LINE) has pulled back into support and sits just above the moving average support lines. This stock will see its distribution go to at least 2.08 annual and that announcement comes any day. So its priced to yield 6.90% so in my view there is strong yield support. And it has pre-announced for April Q1 at 2.28 or priced to yield 7.6%. Ultimately i think this one still heads for the middle 30s in the next few months.

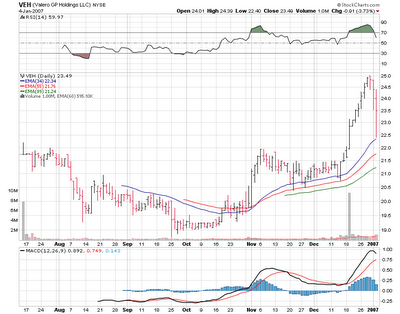
Meanwhile Valero Holdings (VEH) has been straight up since Valero (VLO) finally got rid of its stake of shares. And yesterday the stock seemed to try and correct all in one day as it dropped right to the 34 day moving average before closing a point above it. If the group selloff continues the support lines as always are good places to go shopping for shares.
So lots to ponder this morning as we wait for the open.


No comments:
Post a Comment